 Austria
 Belgium
 Bulgaria
 Cyprus
 Czech Republic
 Denmark
 Estonia
 Finland
 France
 Germany
 Greece
 Hungary
 Ireland
 Italy
Italy Latvia
 Lithuania
 Luxembourg
 Malta
Malta Netherlands
 Poland
 Portugal
 Romania
 Slovak Republic
 Slovenia
 Spain
Spain Sweden
 UK
UK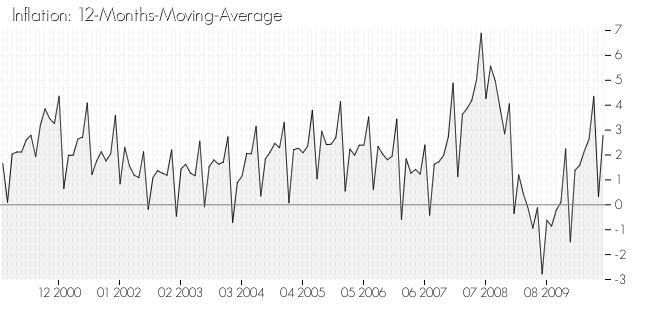
Economy Belgium
| Domestic Economy | ||
| GDP at Purchasing Power | 389.83 bil. PPP$ | |
| GDP per Capita at Purchasing Power | 35,824.70 PPP$ | |
| GDP in local currency Mrd. | 87.28 bil. euros pro Quartal | |
| GDP Growth y.o.y.% | 2.80% p.a. | |
| Consumption Expenditures per Quarter | 46.03 bil. euros | |
| Consumption as % of GDP | 52.74% | |
| Gross Capital Formation | 17.83 euros per Quarter | |
| Gross Capital Formation as % of GDP | 20.43% | |
| Government Consumption | 21.28 bil. euros per Quarter | |
| Government Consumption as % of GDP | 24.38% | |
| Inflation | 2.81% p.a. | |
| Unemployment Rate | 8.70% | |
| International Trade | ||
| Exports | 69.95 bil euros per quarter | |
| Exports as % of GDP | 80.15% | |
| Net exports in local currency | 1.79 bil. euros per Quarter | |
| Trade Balance in USD | -3.50 bil. $ | |
| Current Account in USD | -3.48 bil. $ per Quarter | |
| Foreign Assets | 2,139.95 bil. $ | |
| Foreign Liabilities | 1,995.42 bil. $ | |
| Net Investment Position | 144.53 bil. $ | |