 Austria
 Belgium
 Bulgaria
 Cyprus
 Czech Republic
 Denmark
 Estonia
 Finland
 France
 Germany
 Greece
 Hungary
 Ireland
 Italy
Italy Latvia
 Lithuania
 Luxembourg
 Malta
Malta Netherlands
 Poland
 Portugal
 Romania
 Slovak Republic
 Slovenia
 Spain
Spain Sweden
 UK
UK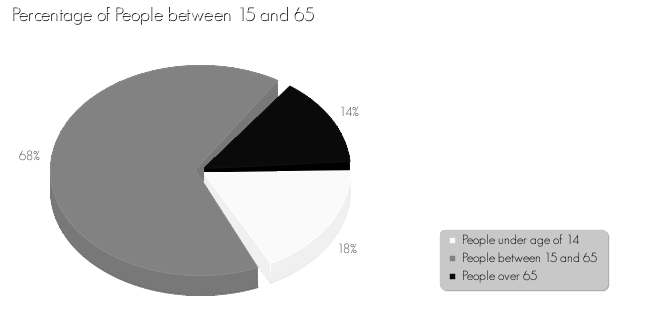
Population and Government Netherlands
| Population | ||
| Population | 16,491,500 persons | |
| Labor Force as % of Total Population | 45.96% | |
| Urban Population as % of Total Population | 89.35% | |
| Average Age | 39.40 years | |
| Birth Rate: Babies per 1.000 People | 10.90 persons | |
| Death Rate: Deaths per 1.000 People | 8.68 persons | |
| Percentage of People under Age of 14 | 18% | |
| Percentage of People between 15 and 65 | 67.80% | |
| Percentage of People over Age of 65 | 14.20% | |
| Government | ||
| Government Receipts | 67.94 bil. euros per quarter | |
| Government Expenditures | 71.52 bil. euros per quarter | |
| Government Expenditures as % of GDP | 49.45% | |
| Government Lending/ Borrowing p.q. | -3.58 bil. euros | |
| Government Borrowing as % of GDP | -2.48% | |
| Government Debt | 402.48 bil. euros | |
| Government Debt as % of GDP | 69.57% | |
| Social Security Spending as % of Total Spending | 45.08% | |